There is no shortage of training advice for rowers.
“Train more”, “Avoid the black hole”, “Train smarter” (whatever that means), “Train like the Danes”, “Avoid junk meters”. The best research has found that what works best for one rower might not work for another.
So what can you do? Plan. Execute. Measure. Adjust. Repeat.
Today there are devices and software to measure fitness and technique. Devices like the Speedcoach GPS, EmPower Oarlock, Concept2
Performance Monitor provide instant feedback to help rowers train to speed, power, rate or heart rate. Smartphone applications like CrewNerd, BoatCoach, and Rowing in Motion provide many of the same parameters.
But real time feedback has limitations. How do you know that you are consistently improving from session to session? How do you know if one element of your technique is falling apart when you are working on another?
These devices and apps collect data. Until now there has been no way to draw meaningful insights from it.
Read on to see the amazing interpretation graphs which you can now get for your personalised rowing data analysis.
Rowsandall.com fills the gap.
Rowsandall is the Rowing Data Analysis website. On it you can:
- Easily upload data from the most popular devices and apps
- Maintain a consistent log of all your rowing (indoor and On The Water)
- Analyze your workouts with a consistent set of tools
- Compare your results between workouts and with other rowers
- Look for long term trends in your training plans
Watch this seminar given at the FISA World Masters Rowing Championships by Rowsandall founder
In it you will learn from him how you can coach yourself using rowing data and the Rowsandall app.
- Using power and heart rate to improve training effectiveness
- What data really helps you understand making the boat go fast and what data shows you stopping the boat
- Technique metrics to improve efficiency in the rowing stroke
How much does Rowsandall cost?
For our Basic user, the website is Free. Within this package you get
- User defined heart rate and power zones
- Synchronization with Strava, SportTracks, Concept2 logbook, RunKeeper. Download CSV and TCX files.
- Session summary, Session Summary Chart and Pie Charts
- Flexible charting of time, distance, stroke rate, power, heart rate
- Interval editor
- Ranking piece pace predictor
With the Pro user: 15 Euros per year
- All basic features
- Flexible charting of drive length, force, work per stroke, and Empower Oarlock data
- Workout power histogram
- Compare workouts
- Data fusion (from different sources)
- Calculate correlations and other statistical analysis
- Weather information
- Stroke power histogram
Team: Price depending on team size
- All basic features
- All Pro features for Team manager
- Management of teams, workouts and line-ups
- See your team member’s workouts and comment them
- Compare workouts between team members
Dive inside Rowsandall
Session Summary (example time plot)
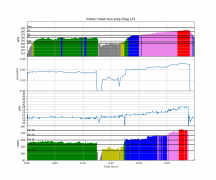 Session Summary Time plot
This standard plot is generated with a single click which summarizes the heart rate, pace, stroke rate and power for the entire session.
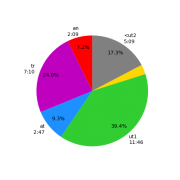
Heart rate based training (example HR pie chart
)
 Heart Rate Training Rowsandall[/caption]
Heart rate based training plans track “time in zone”, the pie chart view provides a graphical summary of how well you hit your session objectives.
 Power based training[/caption]
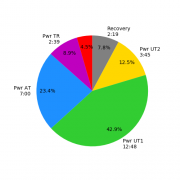
Power based Training (example power pie chart)
Power based training plans track “time in zone: for different power levels. The pie chart is a graphical summary of how well you hit your targets for a session.
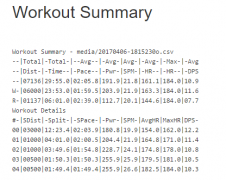
Summarize Interval Results(example summary)
 Interval training summary[/caption]
Tracking all the results for interval sessions is a pain. rowsandall provides an interval editor that helps you separate work strokes from rests and calculates summary statistics for each interval and all the work strokes.
Compare Workouts (example power and HR comparison chart)
Comparison charts help you gauge progress over time. Here, the same workout was repeated after a month of training. The graphs show good progress…higher power and a lower heart rate.
 Compare workouts over time[/caption]
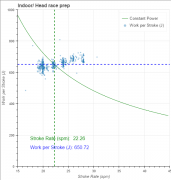
Work on Technique (example of rate versus power)
 Rate versus power curve[/caption]
The Flex Plot capability enables the rower to dig deeper into how to improve. One common technical flaw is losing stroke power as the rate goes up. The flex plot can be used to look at that directly. The controls can be used to focus on just the work strokes, zoom into a section of the session, or only look at certain stroke rates.