Verifying the Accuracy of Measurements-Introduction
In my last post on tracking rowing data, I received a comment regarding the accuracy and measurement of observations—heart rate, in particular. This provided me with an idea to evaluate the best way I know how: take some measurements and compare to establish an estimate of data integrity. One of the best ways of accomplishing this is to take independent measurements from different sources while performing the same activity. The logic behind this is that independent, blind sources will provide the best chance for uncorrelated measurement corroboration.
Experimentation using the Garmin Vivoactive HR and Polar H10
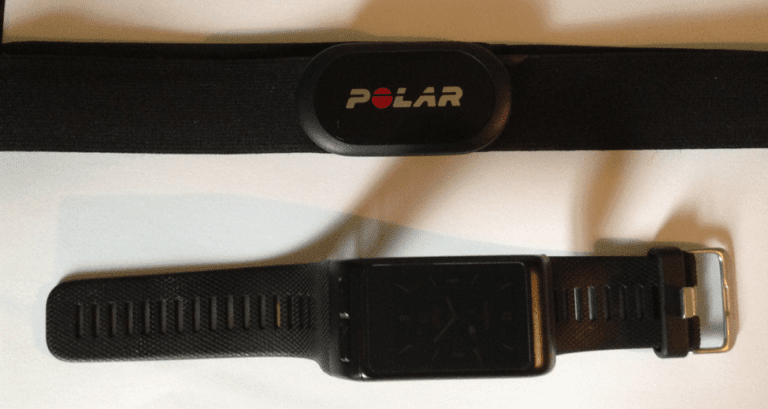
Experimentation needs to be conducted carefully and variables controlled for in order to ensure that what is being measured is truly accurate. The results I present here are not conducted under laboratory conditions so are not perfectly designed. Yet, the results do provide a semblance of “laymen” scientific method, based on the tools and methods available to the average rower. I detail my analysis on my own blog site here at johnrzaleski.com. As was described in my first posting, I have used the Garmin Vivoactive HR smart watch, shown in Figure 1 below. The Garmin unit is able to be used with a number of sports, including rowing, and provides measurements of heart rate, stroke rate, distance per stroke, split times, and also provides for location tracking during the workout. Data can be uploaded to Connect.garmin.com and are also available for download in TCX (an XML format) as well as splits downloads in CSV format. The Polar H10 is strapped around the chest just below the level of the breast bone. This unit, too, can upload data to the flow.polar.com web site, where data can be downloaded in TCX format, as well.
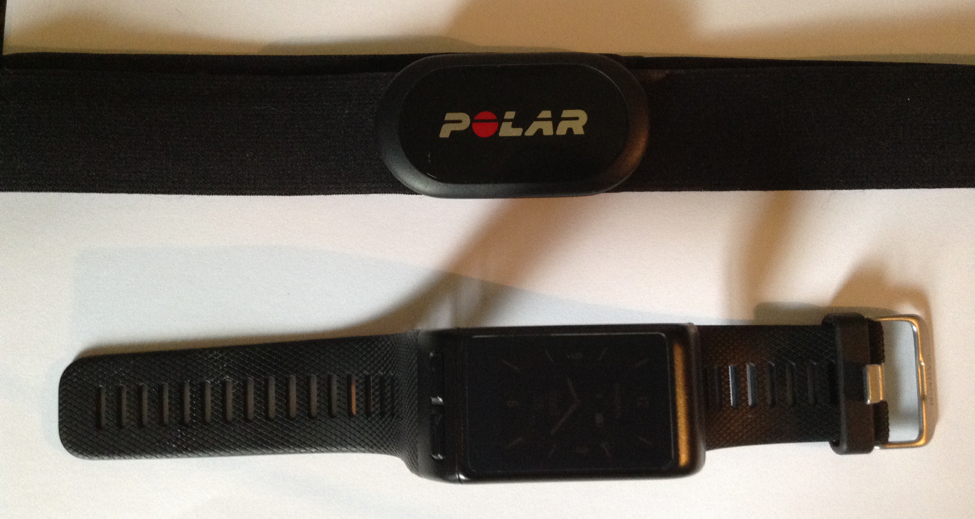 Figure 1: Polar h10 chest strap and garmin vivoactive hr smart watch were used in the comparison.
In order to provide some variety, I considered three different activities:
- General workout, involving weight lifting, sit-ups, squats;
- Walking for 1 mile; and,
- Indoor rowing for 15 minutes.
In all cases, both the Vivoactive HR and the H10 were attached, with the Vivoactive HR snuggly affixed to the left wrist. Both watch and chest strap were properly attached with no movement between these devices and the skin. Data were collected and then downloaded and processed through a Microsoft Excel spreadsheet. The data were time-synchronized so that corresponding data points from each device were associated in time. Plots of the measurements were made and, as I wrote earlier, details of the analysis are on my web site. A summary of the analysis is provided here.
Heart Rate Comparison: Walking
Measurements of heart rate were taken during a one mile walk. The heart rates were plotted against one another and the correlation coefficient was computed between the two sets of measurements. In the case of the comparison shown in Figure 2, the correlation among measurements was rather poor: the correlation coefficient was determined to be -0.54. Perfect correlation is given by the diagonal line in the figure. Interesting to note is that the data points taken from the Vivoactive HR time variance. In the case of the Vivoactive HR, in some instances, the time between measurements was as high as 47 seconds with 62 measurements in the 12-14 second interval range, whereas in the case of the Polar H10, all measurements were 1 second interval. Thus, the number (quantity) of measurements taken by the Polar H10 were far denser than those of the Vivoactive HR.
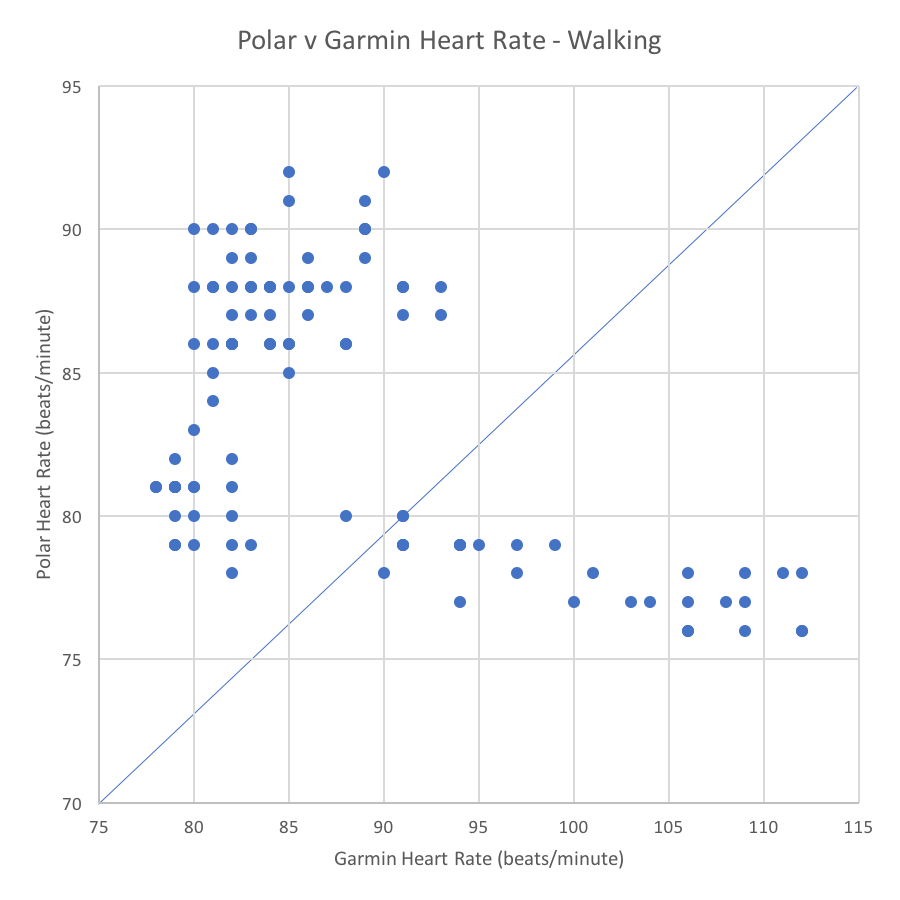 Figure 2: SCATTER PLOT OF HEART RATE MEASURED WHILE WALKING ONE MILE USING THE POLAR H10 VERSUS GARMIN VIVOACTIVE HR. THE CORRELATION COEFFICIENT OF-0.54 WAS DETERMINED BETWEEN THE TWO SETS OF MEASUREMENTS. PERFECT CORRELATION IS SHOWN BY THE DIAGONAL LINE.
Heart Rate Comparison: General Activity
In the case of general activity, which included some weight lifting, sit-ups, leg raises and standing exercises, the heart rate comparison is as shown in Figure 3. The correlation coefficient among these measurements is a bit higher at 0.60. The variation in measurement collection time associated with the Garmin HR was even higher here, with one measurement interval as high as 88 seconds!
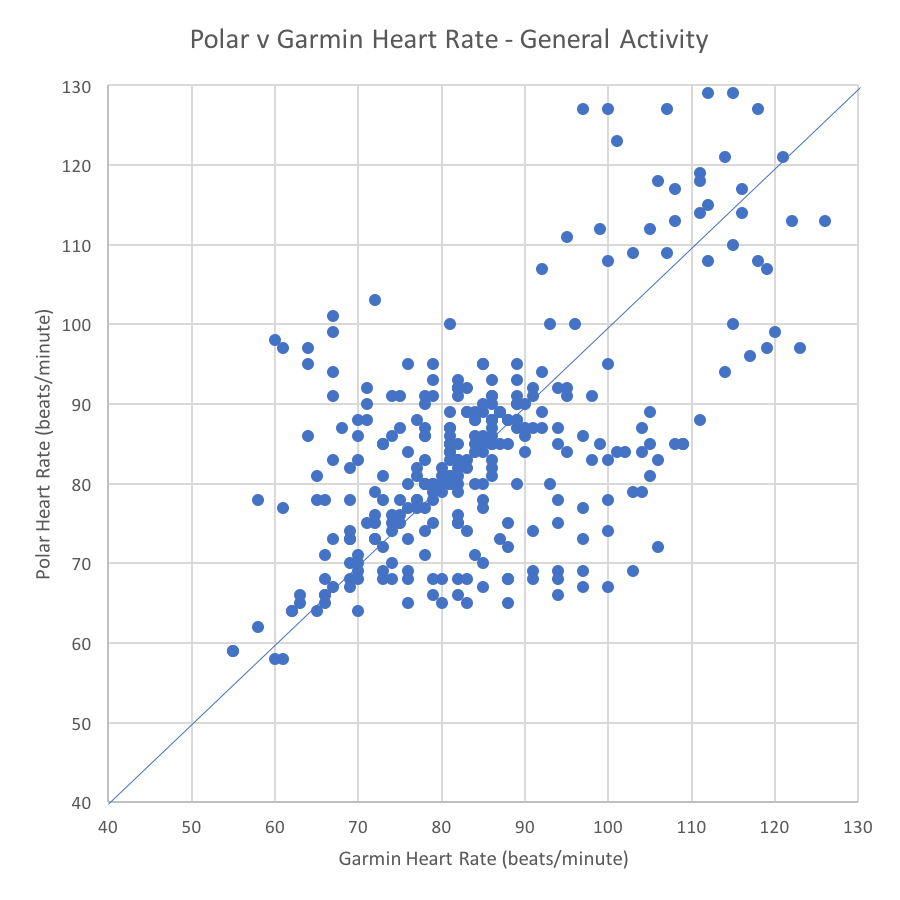 Figure 3: SCATTER PLOT OF HEART RATE MEASURED WHILE PERFORMING WEIGHT-LIFTING, SIT-UPS AND GENERAL STANDING EXERCISES USING THE POLAR H10 VERSUS GARMIN VIVOACTIVE HR. THE CORRELATION COEFFICIENT OF 0.60 WAS DETERMINED BETWEEN THE TWO SETS OF MEASUREMENTS. PERFECT CORRELATION IS SHOWN BY THE DIAGONAL LINE.
I have hypothesized that the wide variation in data collection time may be due to arm motion that is not experienced to the degree in walking. I also have hypothesized that the improved correlation may be due to the higher heart rate, which is more easily detected by the Vivoactive HR. We will see some supporting evidence of this in the final section on indoor rowing.
Heart Rate Comparison: Indoor Rowing
Rowing on the Concept 2 PM5 unit while wearing both the Vivoactive HR and the Polar H10 produced the results as illustrated in Figure 4. The correlation between the Vivoactive HR and the Polar H10 is much higher here, with a correlation coefficient of 0.95. Several items of note: the variation in measurements with the Vivoactive HR is much lower, with only two measurements 19 seconds apart and most measurements having 1-2 second intervals. This complies much more closely with the 1-second measurement intervals of the Polar H10. Furthermore, heart rate measurements are much higher here: some measurements as high as 165 beats/minute (during sprints). In general, corroboration between the two units is better as heart rate measurement is higher. This could be due to more accurate peripheral measurement.
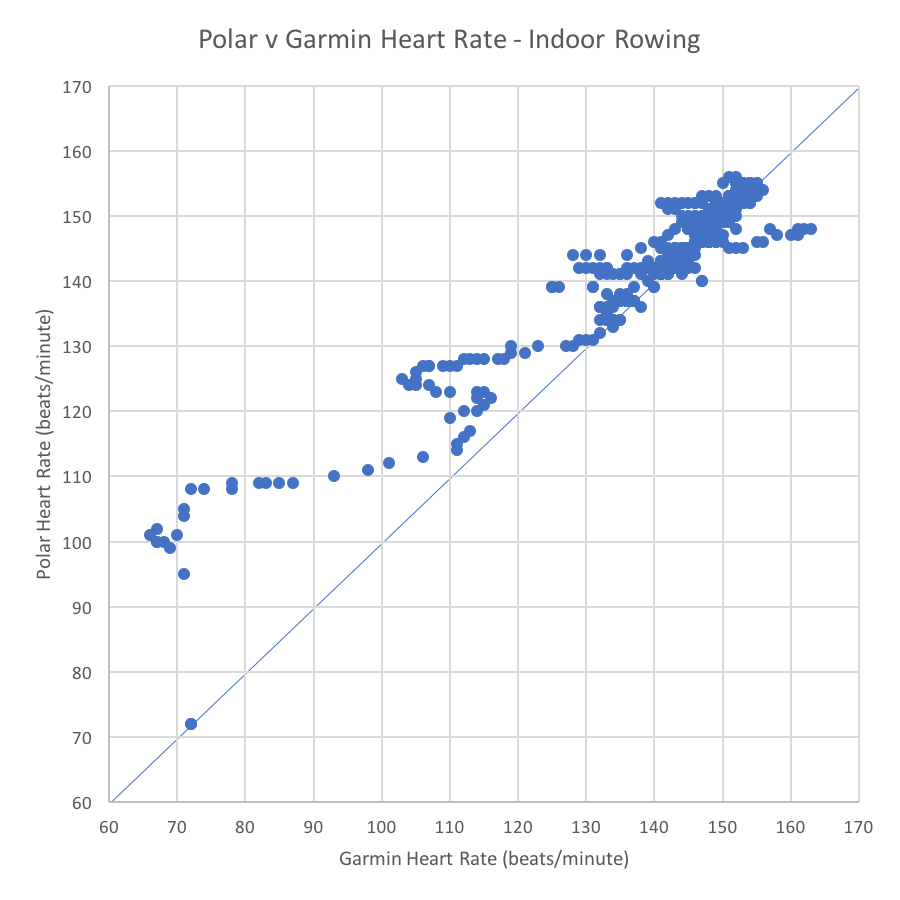 Figure 4: SCATTER PLOT OF HEART RATE MEASURED WHILE PERFORMING indoor rowing USING THE POLAR H10 VERSUS GARMIN VIVOACTIVE HR. THE CORRELATION COEFFICIENT OF 0.95 WAS DETERMINED BETWEEN THE TWO SETS OF MEASUREMENTS. PERFECT CORRELATION IS SHOWN BY THE DIAGONAL LINE.
Conclusions
Based on the limited sampling and workouts thus far, the general conclusion regarding heart rate measurement “trust” is that the Polar H10 is more reliable based on several observations: (1) data collection time variation remains consistent at 1 second; and, (2) data density remains high with no dropouts in any of the workouts. This is not a surprise in general as the conventional wisdom is that chest straps are much more reliable. Yet, I wanted to quantify this reliability using some objective measures. It should be noted that while heart rate remains somewhat questionable with the Vivoactive HR, I have found that stroke rate measurement in comparison with the Concept 2 PM5 measurement is dead on accurate (at least based on the data I have observed).

